A Fairfax Master Naturalists project that I could work from my desk: I cleaned up the automated transcription of a video presentation on climate change, presented by Rachel Licker to Master Naturalists in 2014. Dr. Licker speaks softly, and the AI performing the transcription often made a hash of things. My favorite machine blunder was pursue potations for precipitation, followed closely by 4 percent the patients for for precipitation.
Category: Climate Change
It’s too darn hot
A roundup of coffee agriculture-related stories:
- Falling prices are leading coffee farmers in Guatemala to abandon their farms and relocate to the United States, as Kevin Sieff reports.
- The picture is similarly grim in Colombia, with farmers beset by global heating and unfavorable markets, per Richard Schiffman.
- Agroforestry of coffee and cocoa will be clobbered by losses of fruit, timber, and nitrogen-fixing trees, according to a new paper by Kauê de Sousa et al.
Fall zone
Benjamin Strauss et al. present a harrowing quiz: outline maps of various coastal states under one possible climate change scenario, in which sea level rises by 170 feet over the coming millennia. The geophysical boundary between Coastal Plain and Piedmont is unmistakable; farther south, other states would be obliterated.
Another source
Richard Conniff makes the case for a carbon tax on beef.
Agriculture, including cattle raising, is our third-largest source of greenhouse gas emissions, after the energy and industrial sectors.
* * *
Beef and dairy cattle together account for an outsize share of agriculture and its attendant problems, including almost two-thirds of all livestock emissions,….
* * *
The emissions come partly from the fossil fuels used to plant, fertilize and harvest the feed to fatten them up for market. In addition, ruminant digestion causes cattle to belch and otherwise emit huge quantities of methane [a much stronger greenhouse gas than carbon dioxide].
* * *
The way feedlots and other producers manage manure also ensures that cattle continue to produce methane long after they have gone to the great steakhouse in the sky.
One of tens of thousands
Life achievement unlocked: today for the first time I marched in a major political protest on the streets of Washington, D.C. As a member of the March for Science, I walked from the Washington Monument grounds, within sight of the White House, down Constitution Avenue to 3rd Street, on the fringe of the Capitol grounds. Weather conditions at the rally were less than ideal (drizzle and showers), but I stuck to the principle that there is no such thing as bad weather, just inappropriate clothing.
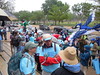 I walked with a group well-organized by Audubon Naturalist Society (that’s us mustering on the steps of the National Museum of Natural History). ANS’s march leaders had the brain wave of bringing decorative bird spinners as a rallying point. The spinners (and the stylin’ t-shirts) brought us lots of attention, especially from journalists major and minor.
Letting go
In the first half of last year, The Guardian produced a very effective closed-end podcast about its reporting and advocacy concerning climate change. With no exaggeration, it can be called The Biggest Story in the World.
For me, the most important episodes consisted largely of interviews with Marc Morano, climate change heckler, and with Ben Van Beurden, CEO of Shell.
The focus of the newspaper’s campaign was to persuade two large charitable foundations to divest from companies dependent on carbon-based fuel extraction—the big oil companies, in short.
Meanwhile, Joel Rose recently reported on stepped-up efforts by gun safety activists, asking pension funds and personal investors to drop gun-related stocks from their portfolios. Does divestment have an impact?
“Well, unfortunately, it does not have an effect,” says Paul Wazzan, an economist at the Berkeley Research Group in California. He has studied the divestment campaigns against companies that did business in South Africa in the 1980s and 1990s. Wazzan says there was no measurable effect on their stock prices.
“But it does generate a lot of press and interest,” Wazzan says. “And the political pressure starts to build and that did ultimately have an effect. It’s not what our paper was about, but I think the political pressure ultimately did have an effect on these companies.”
That kind of pressure is harder to measure than a stock price. But divestment supporters say it’s still worth a try.
Secondary factors
Robert W. R. Parker and Peter H. Tyedmers present research results that indicate that energy consumption by fishing fleets has a significant greenhouse gas effect, perhaps even as important as the tropic level of the fish that’s caught. Fishing for small fish like mackerel and sardines is the least energy-intensive, while going after crustaceans like shrimp and lobster can be worse by a factor of 50, consuming nearly as much energy as raising terrestrial livestock. The disparity is even more pronounced in Europe, where crustaceans are scarcer. April Fulton interprets the results.
So why is all this fuel getting burned? As the fishing industry has evolved in the last century from throwing out a few lines over the local dock to industrialized operations, we’ve been able to fish in more parts of the ocean and freeze our catch right on the boats….
And the boats – not the packing plants or trucks transporting fish to the store — are where the bulk of the burn comes from, Parker says. The energy needed to get fish to the dock accounts for 60 to 90 percent of the fishing industry’s total energy use and emissions.
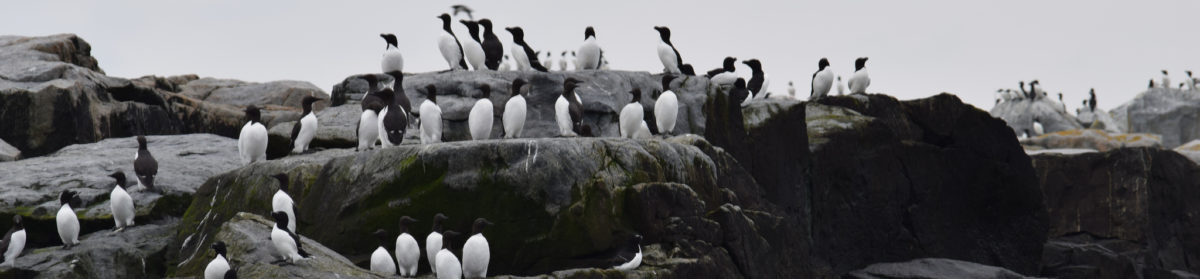
The BPP, again
Sam Droege and Jessica Zelt talk to Dan Rodricks of WYPR about Wells Cooke and the Bird Phenology Project and inferences about climate change to be drawn from its 90-year data set.
Not just for coffee farms
Paul Stapleton introduces “evergreen agriculture.” In Africa, intercropping with trees of the genera Sesbania, Gliricidia, Tephrosia, and others improves yields and provides other benefits; dropped leaves from the trees provide natural fertilizer.
The indigenous African acacia (Faidherbia albida) is perhaps the most remarkable of these fertiliser trees. Faidherbia sheds its nitrogen-rich leaves during the early rainy season and remains dormant throughout the crop-growing period. The leaves grow again when the dry season begins. This makes it highly compatible with food crops, because it does not compete with them for light, nutrients or water during the growing season: only its bare branches spread overhead while the food crops grow to maturity.
Weather and Climate term paper
For our term writing project, Dan Ferandez asked us to critique an article and develop “your own personal ideas and conclusions” on the topic of “global climate change.” Since I had recently read a piece about Judith Curry, finding material to write about was easy. Making a positive contribution to the debate was much more difficult.
Bird Phenology Program
Consistent with another of my volunteer gigs (with Recording for the Blind & Dyslexic), I seem to have positioned myself as a wetware information transcriber. A couple of months ago I started working about an hour a week as a data entry volunteer for the North American Bird Phenology Program, based out of Patuxent Wildlife Research Center.
Phenology is the study of comings and goings in the natural world—what day of the year the swallows return to Capistrano, the lilacs last in the dooryard bloom’d, that sort of thing. Decade-to-decade trends in a particular location can provide additional evidence to researchers studying climate patterns, among other things.
There are a number of phenology programs active under the umbrella of the USA National Phenology Network. One of the broadest-scoped citizen science initiatives was organized in 1881 by Wells W. Cooke, and was later expanded by C. Hart Merriam of the newly-formed American Ornithologists’ Union. For 90 years, up to 3,000 field researchers submitted data on the arrivals and departures of migratory birds in North America, in sort of an ornithological Mass Observation Project. Data was collected on 2×5-inch slips; when the project was wound down in 1970 (as other means of collecting similar data evolved), the records base comprised 6 million of them. In 2003, Sam Droege began efforts to safeguard and digitize the slips.
Many of the records are on a GPO-issued form, designated 3-801 or Bi-801; this form was redesigned a couple of times to collect different data. But many more are simply hand-written slips in a particularly compact shorthand that identifies the species (often simply by a three-digit AOU number), the location and observer, and the dates that the bird was first seen in the course of the year; seen again; seen commonly; and last seen during the breeding or migration season.
As you would expect, the transcription of this data from scanned document images into a web form is not an automatable process. Enter the volunteer scribes. It takes me 30 seconds or more to copy out a card—up to several minutes if I have to puzzle out a location name (Google Maps is my BFF) written in faded fountain pen ink in a cursive handwriting style more suited to wedding invitations. The data collection protocol also provides for observer’s notes on whether the bird breeds in the area, is a winter resident, and assessment of abundance (one point on the scale is the quaintly labelled “tolerably common”)—all that, along with any other notes made by the observer, is to be transcribed into fixed fields or free text. Each observer seems to have a different approach to spelling, punctuation, and capitalization. The opportunity for transcription errors is therefore high, so each card is copied into the database twice, then compared.
There’s lots more to be done: the number of digitized cards only numbers in the few hundred thousands, so if you’re into birds or just have some spare cycles, I would encourage you to sign up for the program. You can request to transcribe cards only for a particular location or a particular species, or you can do what I do and just pull cards at random. I’ve copied slips filed from tiny, obscure places like Hadlyme, Connecticut and Rhoma, Texas; I’ve worked with a card prepared by A. W. Schorger, author of the definitive book on the Passenger Pigeon. No particular knowledge of birds is required; in fact, the procedures we follow call for a literal transcription of the record, no interpretation or corrections allowed. So even if I “know” that the common name of a bird has been changed in the past hundred years, my instructions are to copy what the observer wrote, and to let the researchers clean up the data later.
And that turns out to be a learning experience for me, too. Before I started transcribing, I wasn’t aware that Purple Martin (Progne subis) and Eastern Phoebe (Sayronis phoebe) once had simpler names in common use (Martin, Phoebe). And I had never heard of Holboell’s Grebe, which we know now as Red-necked Grebe (Podiceps grisegena).
Droege and his team have already begun to draft papers from the data, especially looking at patterns of Barn Swallow (Hirundo rustica) migrations. The San Francisco-area ABC affiliate put together a rather fine story on the program.
Some links: 44
In a well-done piece, Paul Krugman explains the difference between a carbon tax and cap-and-trade in terms an economist understands, and in terms a politician understands. And while the former might be preferable in economic terms, a cap-and-trade system has a chance of actually happening. And that’s important:
So what I end up with is basically Martin Weitzman’s argument: it’s the nonnegligible probability of utter disaster that should dominate our policy analysis. And that argues for aggressive moves to curb emissions, soon.
Meat pollution
Elizabeth Kirkwood on the very public decision by Britain’s top climate adviser, Nicholas Stern, to stop eating meat as a means of mitigating global warming. Strong stuff:
Why are we not outraged by what the meat industry and those who support it, which is, let’s face it, most of us, is doing to our planet? Why is meat consumption not stigmatised in the way that driving 4×4 gas guzzlers is?
Blog Action Day 2009
In recognition of Blog Action Day 2009, herewith readings and resources for learning more about this complicated subject called “climate change,” one that is full of ramifications and interdependencies.
At Climate Interactive, you will find links to several simplified policy simulations: via animated graphics, you can see the effect of increased afforestation, decreased CO2 emissions by developed countries, and so on. Also find there an overview of C-ROADS (Climate Rapid Overview and Decision-support Simulator), which is designed to be used by policy-makers (not modellers) and runs on a laptop.
Read Johan Rockström et al.’s recent paper for Nature, “A safe operating space for humanity,” along with expert commentary. The paper’s thesis is that global climate change (as measured by radiative forcing [the rate of energy change per unit area of the globe as measured at the top of the atmosphere] as well as atmospheric carbon dioxide) is just one of ten parameters, all of which must be managed into safe operating levels, that are important for the survival of life on the planet.
We propose that human changes to atmospheric CO2 concentrations should not exceed 350 parts per million by volume, and that radiative forcing should not exceed 1 watt per square metre above pre-industrial levels. Transgressing these boundaries will increase the risk of irreversible climate change, such as the loss of major ice sheets, accelerated sea-level rise and abrupt shifts in forest and agricultural systems. Current CO2 concentration stands at 387 p.p.m.v. and the change in radiative forcing is 1.5 W m-2.
By comparison, the carbon dioxide concentration in the atmosphere, pre-Industrial Revolution, was 280 ppm by volume, and the rate of radiative forcing at the beginning of what is now being called the Anthropocene Epoch was zero. The other parameters (keep in mind that most of these are rates of change rather than values) are:
- rate of biodiversity loss;
- nitrogen and phosphorus cycles;
- stratospheric ozone depletion;
- ocean acidification;
- global freshwater use;
- change in land use;
- atmospheric aerosol loading;
- chemical pollution.
The authors find biodiversity loss (as measured by species extinction rate) and N2 removals from the atmosphere for human use running at the most troubling rates. While the pre-industrial era extinction rate was 0.1-1 species per million species per year, the current rate is something like 100, and order of magnitude more than their proposed redline value of 10. The nitrogen situation may be even worse: pre-industrial man removed no net nitrogen from the air. Rockström et al. propose a limit of 35 million tons per year; the current rate is 121 million tons annually.
A recent leader by The Economist explores the political landscape, and in particular the problem of effective transnational agreements to lower carbon emissions. The U.S. Senate must ratify any international treaty that the President enters into. Arguing that the Kyoto protocol failed because it could not get approval of these 100 Americans, nor did excessive emissions by Kyoto signatories actually lead to sanctions, the editorialist writes:
There is an alternative: moving the negotiations onto a different diplomatic track…. Australia has proposed another route. All countries would come up with a “national schedule” of programmes, such as cap-and-trade and low-carbon regulations. Developed countries would also specify an amount by which they mean to reduce their emissions. These commitments would have the force of domestic law, but would not be subject to international sanctions.
Finally, at the softer end of the spectrum, for inspiration and exhortation, take a look at this anthology assembled by the Union of Concerned Scientists: Thoreau’s Legacy: American Stories about Global Warming, 67 pieces of writing and art “drawn from nearly 1,000 submissions about beloved places, animals, plants, people, and activities at risk from a changing climate and the efforts that individuals are making to save what they love,” available both in print and as a handsomely designed Flash-based interactive.

Squeezed in Panama
Elisabeth Rosenthal reports on the controversial findings of Joe Wright, a senior scientist at the Smithsonian Tropical Research Institute in Panama, that the rate of secondary rain forest formation (through abandonment of farms via urbanization, and other causes) is outpacing the rate of primary rain forest destruction. The arguments critical of Wright and those in his support tend to tangle together the function of rain forests as a carbon sink with their role as a refuge for biodiversity.
Regenerated forests in the tropics appear to be especially good at absorbing emissions of carbon, but that ability is based on location and rate of growth. A field abandoned in New York in 1900 will have trees shorter than those growing on a field here [in Central America] that was abandoned just 20 years ago.
For many biologists, a far bigger concern is whether new forests can support the riot of plant and animal species associated with rain forests. Part of the problem is that abandoned farmland is often distant from native rain forest. How does it help Amazonian species threatened by rain-forest destruction in Brazil if secondary forests grow on the outskirts of Panama City?
Here in the East, you can observe the results of old field succession by taking a short drive to the Blue Ridge. Much of the now-protected parkland in the Appalachians was once in agricultural production, as the evidence of a family cemetery in the woods will attest.